Exploring the History of Lego

The project encompassed a wide range of tasks, from data ingestion and storage to transformation, orchestration, and visualization. For further details, please refer to the GitHub Repository linked here.
Unveiling the History of Lego: An Analytical Engineering Journey
Introduction
Lego has fascinated generations with its colorful bricks and endless possibilities for creativity. As a data enthusiast, I embarked on a journey to explore the history of Lego through data. This blog post details my comprehensive data engineering project, from data ingestion to transformation and orchestration, using modern tools like Snowflake, SnowSQL, dbt, Dagster, and Power BI. Join me as I uncover valuable insights into the evolution of Lego.
Project Overview
This project involves collecting, storing, transforming, and analyzing Lego datasets to gain insights into its rich history. The primary objective is to analyze various aspects such as colors, parts, and themes of Lego sets over the years.
Tools and Technologies Used
- Snowflake: For cloud-based data storage and querying.
- SnowSQL: For seamless data ingestion.
- dbt (Data Build Tool): For data modeling and transformation.
- Dagster: For orchestrating and running data pipelines.
- Power BI: For data visualization and dashboarding.
Step-by-Step Journey
1. Setting Up the Database on Snowflake
Objective: Create a robust data warehouse to store the Lego dataset.
Steps:
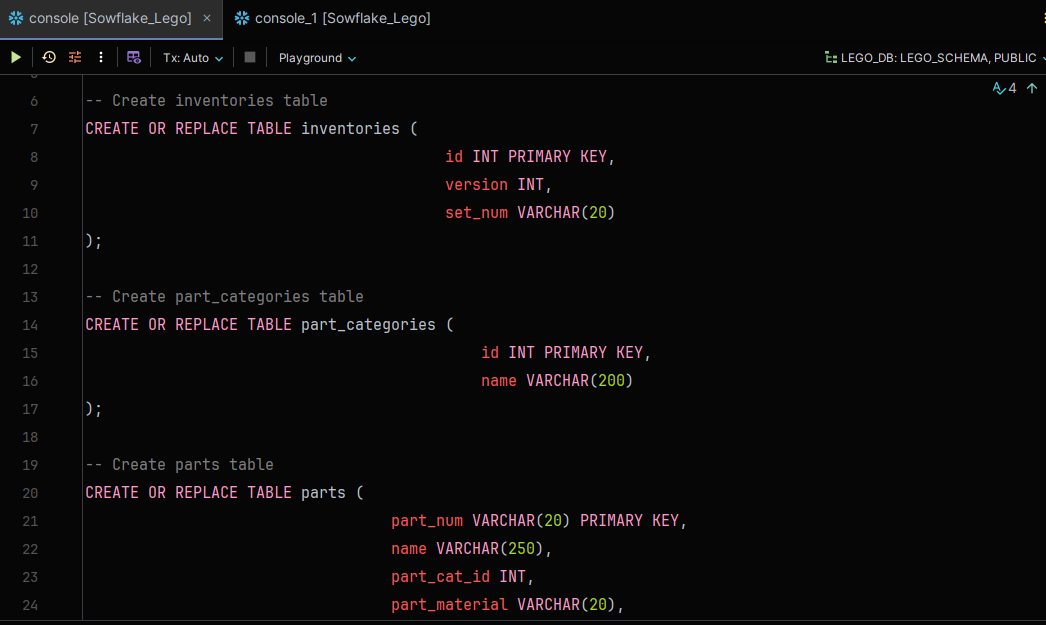
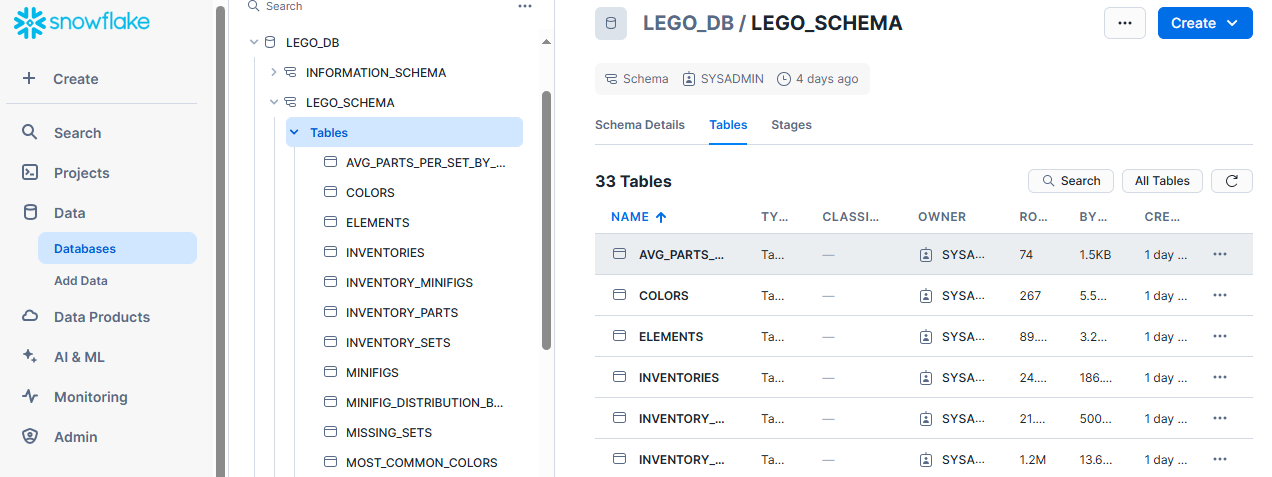
- Warehouse Creation: I started by creating a warehouse named
MY_WAREHOUSEin Snowflake. - Database and Schema Setup: Created a database named
LEGO_DATABASEand a schema namedLEGO_SCHEMA. - Table Creation: Designed tables to store different Lego data aspects, including colors, sets, parts, and themes.


2. Ingesting Data with SnowSQL
Objective: Efficiently load Lego datasets into Snowflake.
Steps:
- SnowSQL Configuration: Set up SnowSQL to connect to Snowflake as the data destination and configured the data source as local CSV files stored in my directory.
- Data Synchronization: Successfully synchronized and loaded the data into the respective Snowflake tables.
3. Data Transformation with dbt
Objective: Clean, transform, and model the data for in-depth analysis.
Steps:
- Project Setup: Created a dbt project directory structure and configured the necessary files for database connection.
- Development: Used JetBrains DataSpell IDE for local development of dbt models. Organized the models into directories for staging, aggregations, transformations, and more.
- Transformation and Testing: Implemented complex data transformations and added automated tests to ensure data quality.
- Documentation and Version Control: Generated documentation for data models and transformations and managed the project using Git. The project is available on GitHub: dbtLego GitHub Repository.
4. Enhancements
Objective: Add additional columns to enhance data analysis capabilities.
Steps:
- Table Alterations: Added an
img_urlcolumn tosets,inventory_parts, andminifigstables. Also addedpart_materialanddesign_idcolumns topartsandelementstables, respectively. Modified thenamecolumn length in thethemestable for better data handling.
Project Structure
Here’s a glimpse of the project directory structure for better understanding:
|
|
dbt_project.yml: The main configuration file for the dbt project.packages.yml: Configuration file for dbt packages (external dependencies).analyses/: Directory for storing analysis files.macros/: Directory for custom macros (reusable SQL functions).seeds/: Directory for seed data files (e.g., static data, lookups).snapshots/: Directory for snapshot files (capturing data at a specific point in time).target/: Directory where the compiled SQL files and documentation are generated.tests/: Directory for storing data tests.models/: Directory containing the main dbt models organized into subdirectories.staging/: Models for staging raw data.aggregations/: Models for aggregating data.transformation/: Models for transforming and enriching data.errors/: Models for handling errors and data quality issues.analysis/: Models for performing advanced analyses.schema.yml: Configuration file for defining the model schema.
README.md: The project’s README file.profiles.yml: Configuration file for defining database connections and credentials.definitions.py: Dagster configuration file.
Features
The dbt project provides several powerful features for data transformation and modeling:
- Data Modeling: Organize and structure the Lego dataset into meaningful models for analysis.
- Data Transformation: Implement complex transformations and calculations to derive insights from the data.
- Documentation: Automatically generate documentation for the data models, transformations, and tests.
- Testing: Ensure data integrity and accuracy with automated tests.
- Version Control: Manage changes to the data models and transformations using version control systems like Git.
- Scalability: Scale to handle large datasets and complex analyses.
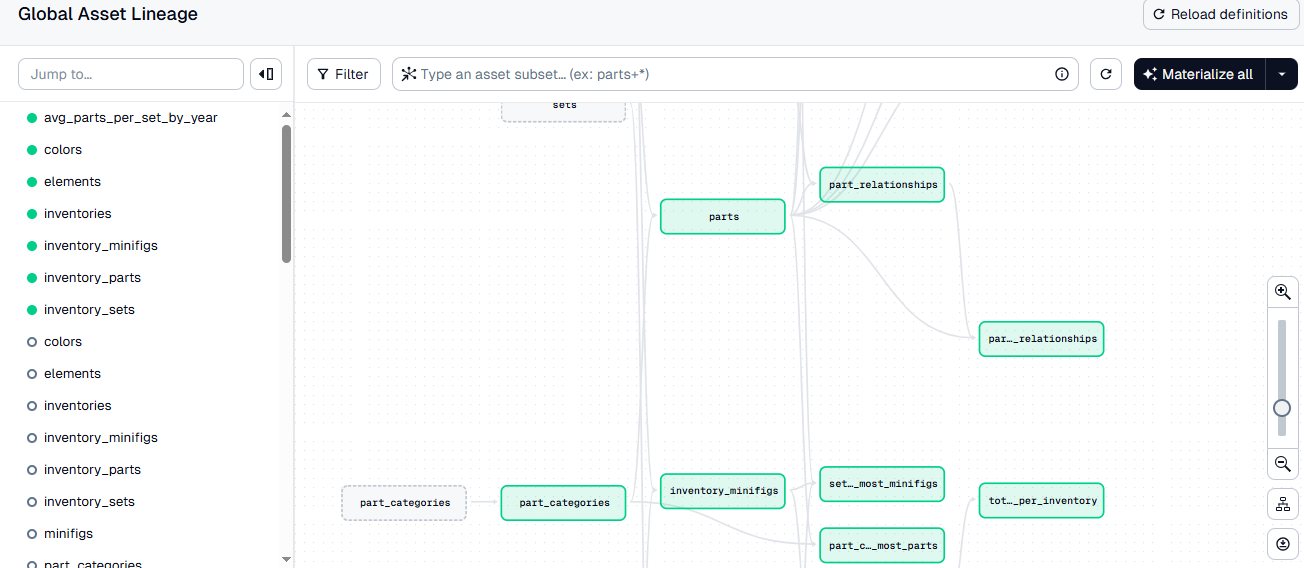
dbt lineage
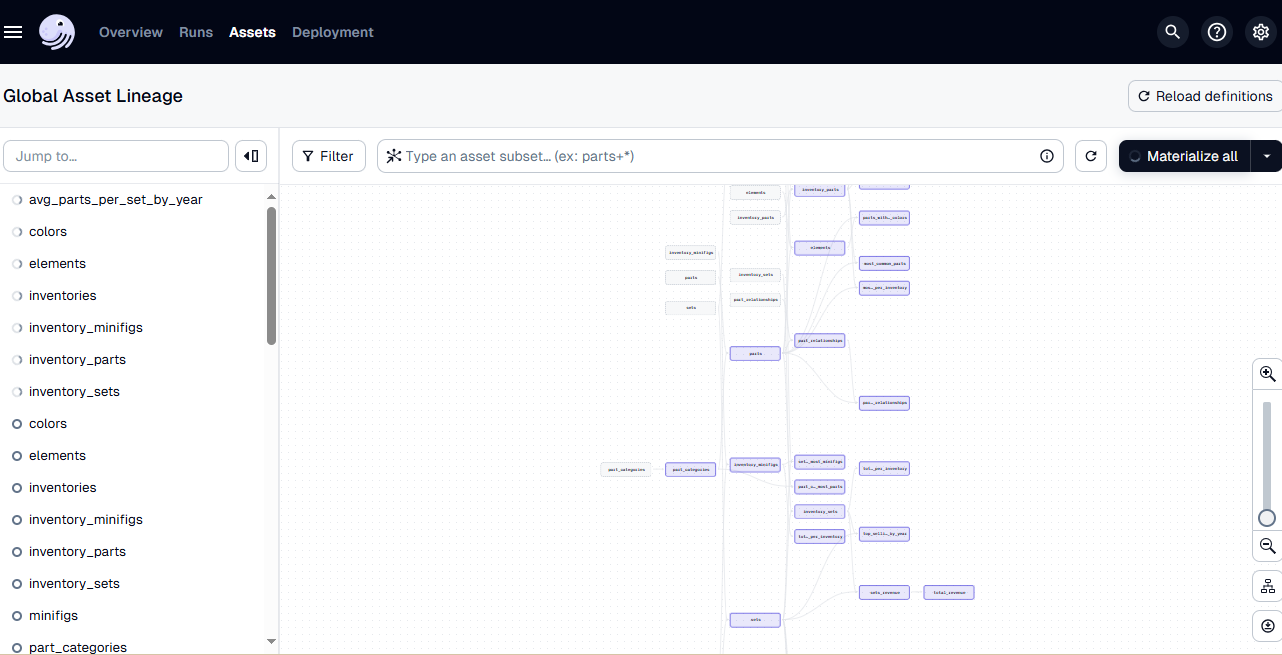
5. Orchestrating with Dagster
Objective: Automate and monitor data transformations using Dagster.
Steps:
- Installation: Installed Dagster and dbt using pip:
pip install dagster-dbt dagster-webserver. - Project Setup: Created a
definitions.pyfile in the same directory as the dbt project directory. Added the necessary code to define Dagster assets and schedules. - Running Dagster’s UI: Started Dagster’s UI to visualize and manage the dbt assets. Accessed the UI at
http://127.0.0.1:3000to manually or automatically materialize assets.
Dagster is integrated into the project to schedule and manage the data workflows. This allows for the automation of data transformations, ensuring that the data is always up-to-date and ready for analysis.
How it Works
- Setup: Installed Dagster and configured it to work with the dbt project.
- Scheduling: Set up a schedule to run the dbt models daily at midnight.
midnight schedule
- Execution: Dagster manages the execution of dbt models, allowing for easy monitoring and troubleshooting.


6. Visualization with Power BI
Objective: Create an interactive and visually appealing dashboard to present the insights derived from the data.
Steps:
- Dashboard Creation: Used Power BI to design a comprehensive dashboard titled ‘LEGO Sets and Parts Insights’.
- Key Visual Elements:
- Most Common Colors: A bar chart displaying the most frequently used colors in Lego parts.
- Total Quantity for Most Common Parts: A horizontal bar chart highlighting the parts with the highest quantities.
- Top Selling Set by Year: A table listing the top-selling Lego sets for each year.
- Total Quantity and Total Revenue: Key performance indicators (KPIs) summarizing the total quantity of parts and total revenue.
- Average Parts Number by Year: A line chart illustrating the average number of parts per set over the years.
- Design and Interactivity: Ensured the dashboard is both informative and visually engaging, leveraging Power BI’s interactive capabilities for dynamic data exploration.
LEGO Sets and Parts Insights
LEGO Sets and Parts Insights Dashboard
Our dashboard, titled ‘LEGO Sets and Parts Insights’, provides a comprehensive overview of the key findings from our data analysis. The dashboard includes the following visual elements:
-
Most Common Colors:
- A bar chart displaying the most frequently used colors in LEGO parts. The chart shows that Black, White, and Light Bluish Gray are among the most common colors, reflecting their popularity and versatility in LEGO sets.
-
Total Quantity for Most Common Parts:
- Horizontal bar chart highlighting the parts with the highest quantities. This visual reveals that parts like “Plate 1 x 2” and “Plate Round 1 x 1” are the most abundantly used components in LEGO sets.
-
Top Selling Set by Year:
- A table listing the top-selling LEGO sets for each year. This visual provides a quick reference to the most popular sets over time, showcasing trends and shifts in consumer preferences.
-
Total Quantity and Total Revenue:
- Two key performance indicators (KPIs) that summarize the total quantity of parts and total revenue. These KPIs offer a snapshot of the overall scale and financial impact of LEGO’s product lines.
-
Average Parts Number by Year:
- A line chart illustrating the average number of parts per set over the years. This chart demonstrates how the complexity and size of LEGO sets have evolved, with a noticeable increase in the average number of parts in recent years.
Design and Interactivity
The dashboard is designed to be both informative and visually engaging.
The use of bar charts, tables, KPIs, and line charts allows for a multifaceted exploration of the data. The color scheme, layout, and chart types were chosen to ensure clarity and ease of interpretation.
The ‘LEGO Sets and Parts Insights’ dashboard effectively translates complex data into actionable insights, making it easier to understand the trends and patterns in LEGO’s history. By leveraging Power BI’s interactive capabilities, users can explore the data dynamically, gaining deeper insights into LEGO’s product evolution and market performance.
Conclusion
This project showcases a complete data engineering workflow, from data ingestion and transformation to orchestration and visualization. By leveraging modern tools like Snowflake, SnowSQL, dbt, Dagster, and Power BI, I was able to uncover fascinating insights into the history of Lego. This comprehensive approach ensures data accuracy, scalability, and efficient processing.
Final Thoughts
This project has been an incredible journey into the world of data engineering, blending historical exploration with technical prowess. Whether you’re a data enthusiast or a Lego fan, I hope this inspires you to dive into your own data projects and uncover the stories hidden within.
Author
- LinkedIn: Mohammed Mebarek Mecheter
- Email: mohammedmecheter@gmail.com
- GitHub: Mohammed Mebarek Mecheter